As we move further into the digital age, dashboard design continues to evolve. Dashboards, which serve as centralized hubs for monitoring and interacting with data, are increasingly crucial for businesses, organizations, and individuals. Whether for enterprise software, analytics tools, or even personal projects, dashboards provide critical insights that drive decision-making processes.
In 2025, dashboard design is set to become more sophisticated, integrating advanced features, improving usability, and delivering a better overall user experience. Let’s explore the key dashboard design trends to watch in 2025.
1. Minimalist and Clean Interfaces
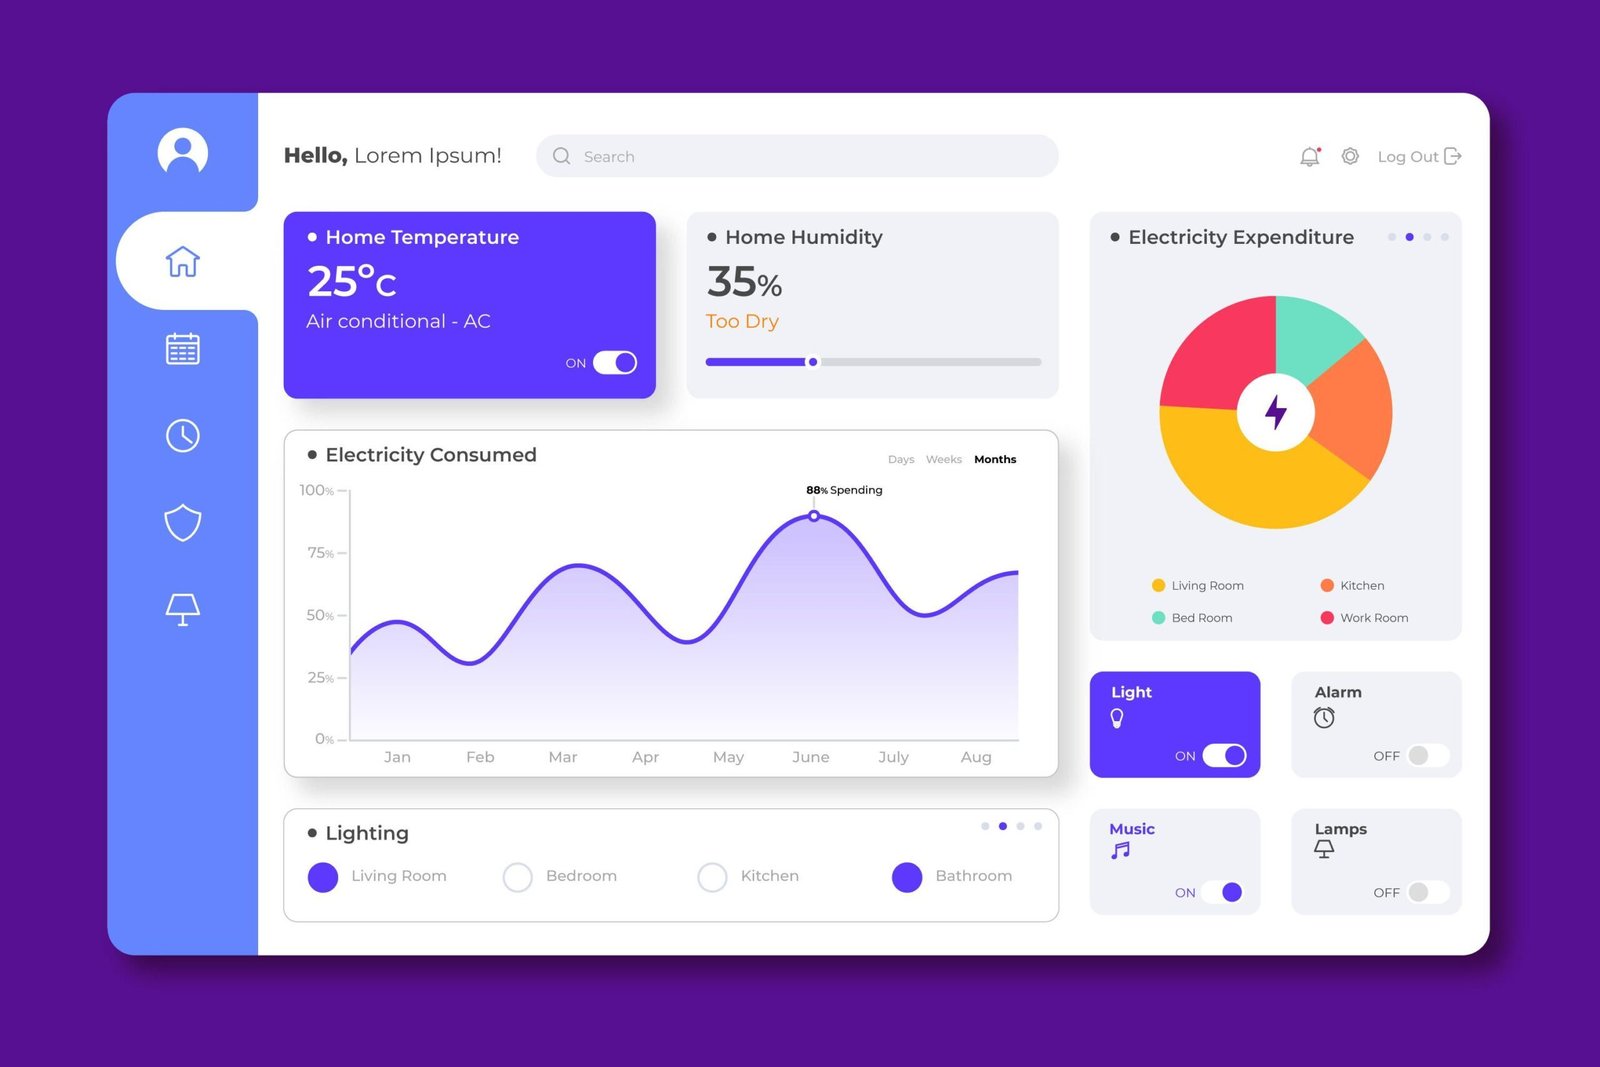
The trend of minimalist design is going nowhere in 2025. Dashboards will continue to evolve with sleek, clean layouts that prioritize essential information and features, eliminating unnecessary clutter. This approach is not just about aesthetics; it’s about improving usability. By simplifying visual elements, dashboards become easier to navigate, allowing users to focus on the data that matters most.
Key elements of this trend:
- Use of whitespace to create visual separation between different sections.
- Fewer visual elements (icons, text, buttons) to avoid distraction.
- Prioritization of essential metrics, with less emphasis on extraneous information.
This trend ensures that users are not overwhelmed by excessive information and can quickly access the most critical data.
2. Personalized Dashboards
In 2025, dashboards will be more personalized than ever before. A one-size-fits-all approach is increasingly outdated, and users now expect dashboards that cater to their specific needs, preferences, and roles. Personalization can come in various forms, including adjustable layouts, customizable widgets, and tailored content.
For example:
- Users may be able to rearrange widgets, change themes, and even define what data appears on their dashboard.
- Role-based customization allows different users (e.g., executives, team leads, analysts) to have dashboards that highlight the metrics most relevant to their tasks.
Personalized dashboards improve productivity by allowing users to focus on the data they care about and eliminating the need to navigate through irrelevant information.
3. AI-Powered Dashboards
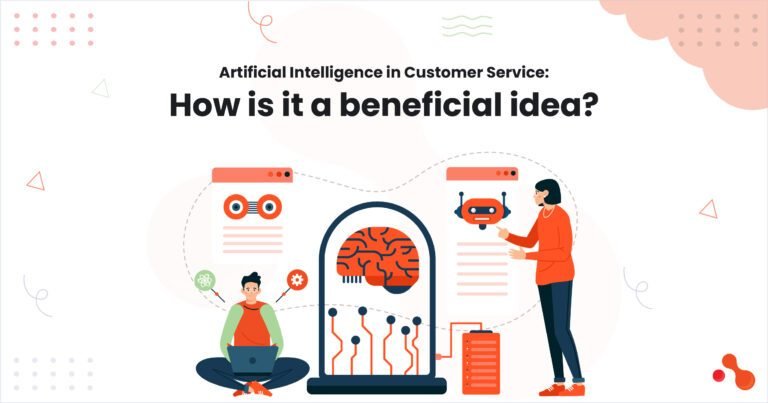
Artificial intelligence (AI) will play a major role in enhancing dashboard functionality in 2025. AI-powered dashboards will provide users with more than just data visualization—they will be able to deliver actionable insights, predictions, and recommendations based on real-time data analysis.
Key features powered by AI:
- Data Insights: AI can automatically detect patterns, trends, or anomalies in the data, alerting users to important events that may require their attention.
- Predictive Analytics: AI can forecast future trends or performance based on historical data, helping users make data-driven decisions.
- Smart Recommendations: AI can suggest specific actions or workflows to users based on their past behavior and data interaction.
With these capabilities, AI-powered dashboards will help users make faster, more informed decisions and automate parts of the analysis process.
4. Interactive and Dynamic Dashboards
In 2025, dashboards will become more interactive and dynamic, allowing users to engage directly with the data. This shift will enhance user experience by offering more control and flexibility in how data is viewed and analyzed.
Examples of interactive elements:
- Hover-activated tooltips: Users can hover over specific elements on the dashboard (e.g., graphs or charts) to get more detailed insights or data breakdowns without having to navigate to another page.
- Drill-down capabilities: Users can click on specific data points to drill deeper into more granular information, offering an in-depth exploration of the data without leaving the main dashboard.
- Real-time data filtering: Dashboards will allow users to interactively filter data in real-time, changing the visualizations or reports based on the criteria they select.
These interactive features will help users manipulate data on the fly, creating a more tailored experience and enabling faster decision-making.
5. Dark Mode and Custom Themes
As dark mode continues to gain popularity across digital platforms, dashboards will increasingly offer customizable themes, including dark mode. Dark mode provides a more comfortable viewing experience, especially in low-light environments, and can reduce eye strain over long periods of use.
In 2025, dashboards will not only provide dark mode but will also allow users to choose from a variety of themes or color schemes. This customization will help align the dashboard’s look with the user’s preferences or the company’s brand guidelines.
Key benefits:
- Improved readability: Dark mode can improve readability in certain environments, reducing glare and eye fatigue.
- Customizability: Users can align the dashboard’s design with their aesthetic preferences, enhancing comfort and user experience.
Customizable themes will be an important feature in 2025, offering both functionality and personalization.
6. Voice User Interface (VUI) Integration
In 2025, voice interfaces will become more integrated into dashboard designs. Voice-enabled dashboards will allow users to interact with the system through voice commands, improving accessibility and efficiency. For instance, instead of manually searching for data or clicking through multiple menus, users can simply ask the dashboard to perform specific tasks.
Possible voice commands could include:
- “Show me sales performance for this quarter.”
- “Give me an update on customer satisfaction metrics.”
- “Create a new report for the last 7 days.”
Voice assistants integrated into dashboards will be especially valuable for hands- operations, making it easier for users to multitask or interact with the dashboard while on the go.
7. Augmented Reality (AR) Dashboards
Augmented Reality (AR) is poised to enter the dashboard design space by 2025. AR will enable users to interact with data in entirely new ways, such as visualizing metrics in 3D or placing virtual elements into the real world.
For example:
- AR can display data on physical objects, overlaying graphs and statistics in real-time when viewed through a smartphone or AR glasses.
- Virtual charts, graphs, and dashboards could be placed in a user’s physical space, creating an immersive data experience.
While still an emerging technology, AR has the potential to revolutionize the way users interact with dashboards by providing richer, more interactive data visualizations.
8. Advanced Data Visualizations
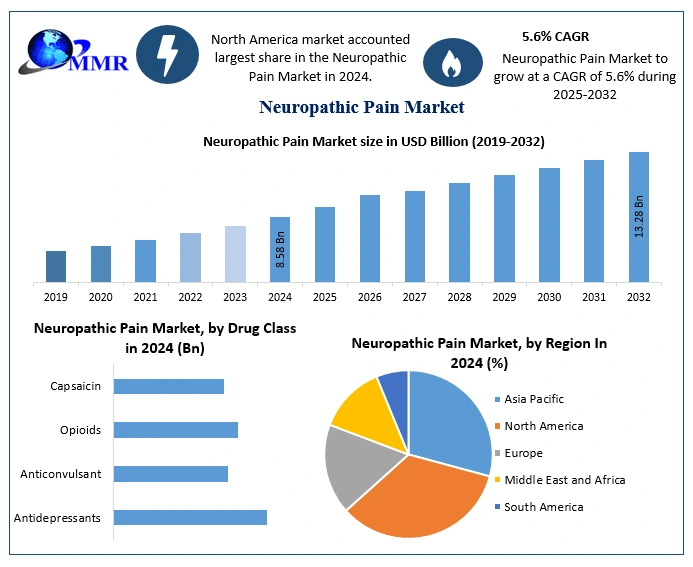
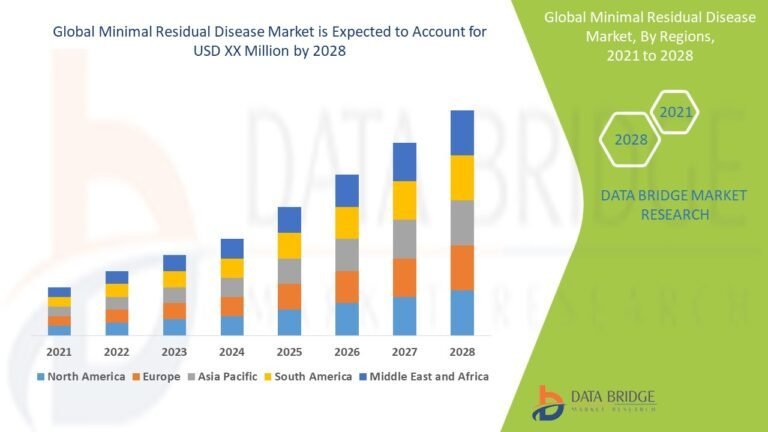
Data visualization is already a key component of dashboards, but in 2025, it will become even more advanced. With the increasing complexity of data, users will need sophisticated yet easy-to-understand ways to visualize trends, performance, and key metrics. New charting techniques and data visualizations will evolve to offer deeper insights.
Key trends in data visualization:
- 3D and animated charts: These visualizations can help display data with greater depth and complexity, making it easier for users to identify patterns and correlations.
- Geospatial data visualization: Dashboards will incorporate geospatial elements, allowing users to visualize data on maps or geo-based charts, which can be especially useful for logistics, sales, or location-based metrics.
- Heatmaps and advanced graphing techniques: More dynamic heatmaps and sophisticated graphs will be integrated, helping users understand large datasets quickly and easily.
These advanced visualizations will make it easier for users to interpret complex data, thus enabling better and faster decision-making.
9. Mobile-First and Responsive Design
With the increasing use of mobile devices, dashboards must be optimized for smartphones and tablets. By 2025, responsive design will be even more crucial as users expect to interact with dashboards seamlessly across all devices.
Key features of mobile-first design:
- Dashboards that adjust to different screen sizes, maintaining usability and legibility on small screens.
- Touch-friendly interfaces that allow for intuitive navigation and interaction on mobile devices.
- Simplified layouts that focus on the most critical information for mobile users, with options to view additional data when needed.
A mobile-first approach ensures that users can access and interact with their dashboards efficiently, whether at their desk or on the go.
Conclusion
As technology continues to evolve, so too does the way we interact with data. In 2025, dashboard design will be more user-centric, interactive, and data-driven than ever before. Minimalism, personalization, AI, advanced data visualization, and the integration of emerging technologies like AR and voice interfaces will all play a role in shaping the future of dashboard design.
Devoq Design is a leading UI/UX design agency serving businesses in UI/UX Design Agency in Rockhampton and UI/UX Design Agency in Hervey Bay , offering innovative and user-focused design solutions that elevate digital experiences. With a deep understanding of user behavior and business goals, Devoq Design crafts intuitive and visually appealing interfaces that are tailored to meet the unique needs of each client. From wireframing and prototyping to user testing and final launch, the agency ensures seamless, responsive designs that enhance user satisfaction and drive engagement. Whether you’re launching a new app, website, or software, Devoq Design provides the expertise needed to create a product that truly connects with your audience.
